Content on this page requires a newer version of Adobe Flash Player.

Get Adobe Flash player

Home
Observing
Astrophotography
Telescopes
Dark Skies
Star Parties
Solar System
Light Pollution


<a href='/solarsystem/sun/index.html'>sun</a> Sun
mercury Mercury
venus Venus
earth Earth
mars Mars
jupiter Jupiter
saturn Saturn
uranus Uranus
neptune Neptune
pluto Pluto
Planet Stats
Planet Sizes
Planets & Stars
A Light Year
sunspot

Some years there are more sun spots than others.

Intro
Structure
Sunspots
Spot Cycle
Flares
Probes
 
The 11 Year Sun Spot Cycle
 
In the early 1700s astronomers bagan counting the number of sun spots on the surface of the sun. After a few years they noticed there were less sun spots. In fact there were very few sun spots in the early 1700s. Although the observations were not as extensive as in later years, the Sun was in fact well observed during this time and this lack of sunspots is well documented. This period of solar inactivity also corresponds to a climatic period called the "Little Ice Age" when rivers that are normally ice-free froze and snow fields remained year-round at lower altitudes. There is evidence that the Sun has had similar periods of inactivity in the more distant past. The connection between solar activity and terrestrial climate is an area of on-going research.
 
If one plots the total number of sunspots observed in a year as a function of the year the plot shown below is obtained. There is a variation in the number of sunspots that is cyclical with a period of approximately 11 years. This 11 year periodicity is called the sunspot cycle. The last solar maximum (period of maximal sunspot activity was in the year 2001-2002.
 

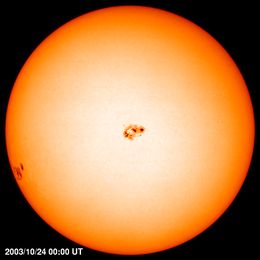
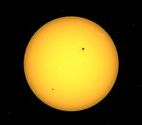
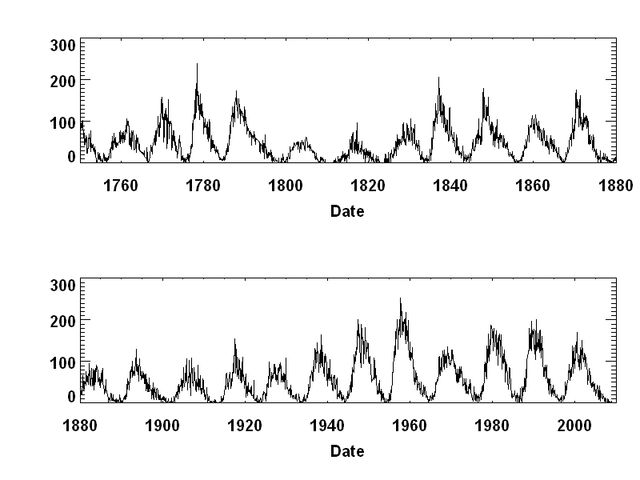
Beginning in the late 1800s, more detailed observations of sunspots have been obtained and recorded. Scientests began to notice that that there was a pattern to the increace and decreace in the number of sun spots. The decline and increace form a cycle with a period of 11 years.

Sun Spot Cycle
These observations include information on the sizes and positions of sunspots as well as their numbers. These data show that sunspots do not appear at random over the surface of the sun but are concentrated in two latitude bands on either side of the equator. A butterfly diagram (142 kb GIF image) (184 kb pdf-file) (updated monthly) showing the positions of the spots for each rotation of the sun since May 1874 shows that these bands first form at mid-latitudes, widen, and then move toward the equator as each cycle progresses.
 
Site Map Observing Telescopes Books Dark Skies Star Parties Favorite Objects